Research

Crime Statistics in 2012: Where does Virginia stand?

Have you noticed how many television channels currently have programs with story-lines woven around crime or law enforcement? With so many police dramas and crime series floating around the pool of broadcasting networks, I couldn’t help but wonder what the recent crime statistics looked like in the real world. These numbers are quite important because […]

Analyzing “I Do”

How many of you have ever checked out Google’s Ngram Viewer?  Here’s a spin-off for any armchair demographers out there: a tool for analyzing The New York Times Weddings/Celebrations Section, WeddingCrunchers.com.  (The creators have a similar tool for rap lyrics, called Rap Stats.)If you’ve never seen or heard of an n-gram before, it’s a name […]

A map that shows what’s wrong with Washington

The recent government shutdown and flirtation with default has seriously deteriorated public trust in Congress, and in Washington more generally.  Disgust with Washington is often followed by bewilderment. How did things get this way?While there is no single answer to this question, if I had to choose one, it would be current redistricting practices. There […]

Changing Dynamics of Multigenerational Households, 1960-2010

Recently, Pew Research Center reported on an increased prevalence of multigenerational families, in which children live in the same household as their grandparents. Nationally, roughly 1 million more children live in a multigenerational household in 2011 than did in 2000. In 2011, one in ten children live in a household configuration that includes at least one grandparent.The […]

Need Census data during the shutdown?

One of the little noticed effects of the federal government shutdown is that many federal statistics and reports that we rely on are currently on hold.  For example, the all-too-important September jobs report never came, and if the shutdown continues, we all may miss out on measuring the unemployment rate for October.  Even updates to the […]

Little Green Boxes

One of the most frequent observations from people who have recently viewed our new Racial Dot Map is the presence of these “little green boxes” scattered throughout the country.  The map displays a single dot for every person counted during the 2010 Census and every dot on the map is color-coded by race and ethnicity:  non-Hispanic […]

Breadwinner Moms in Virginia: A closer look at unmarried mothers

As mentioned in a previous post, much of the research and conversation about “breadwinning” mothers simplistically distinguishes between only two groups: married and unmarried mothers.  But there is a third group that is often not considered—women who are unmarried, but living with a partner.Non-marital cohabitation is on the rise in the United States:  In 2009, […]

Home Building: Now for something completely different

During the past decade major changes in population growth patterns were evident in Virginia. In contrast to what happened in the early 2000s housing boom, when many counties on the edges of urban areas became some of the fastest growing in the country, when the boom ended, these same “exurban” counties declined in population. At the […]

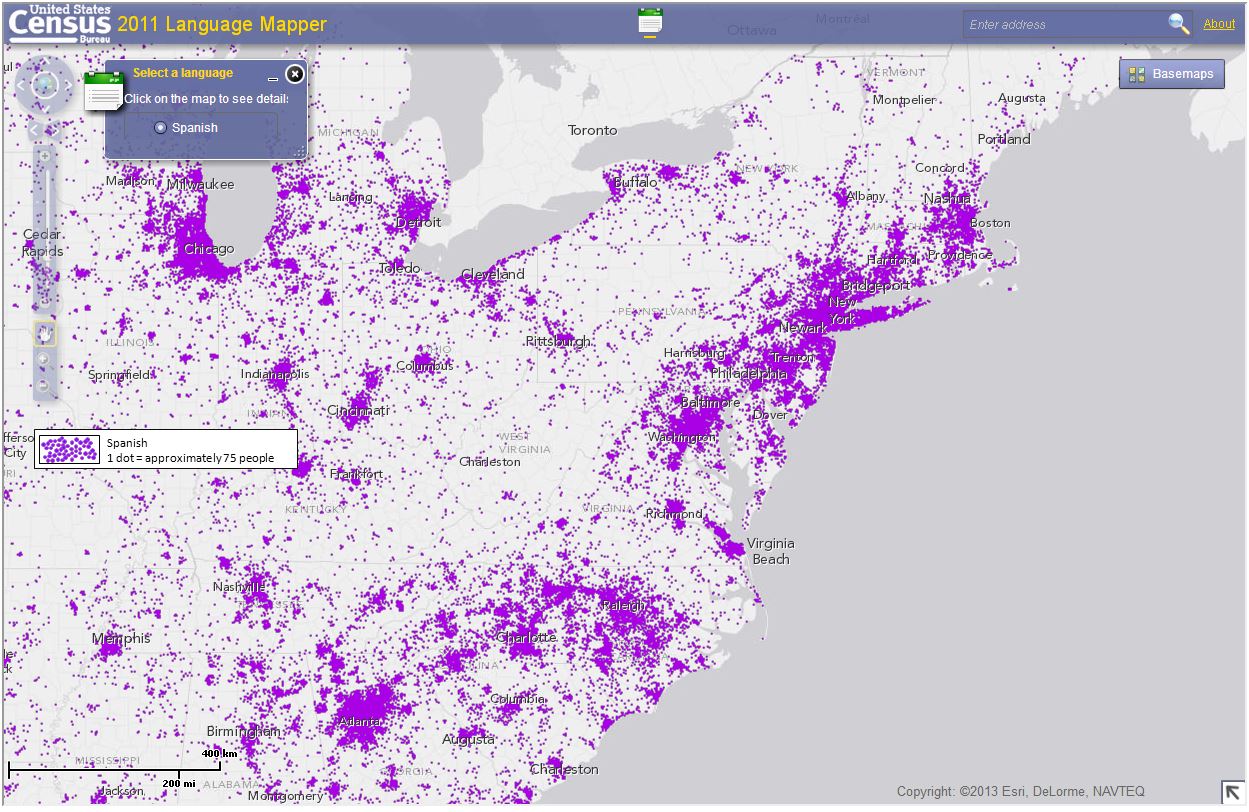
The Census Bureau’s new Language Mapper

As far as afternoon diversions go, the latest language use visualization from the U.S. Census Bureau is one of the more entertaining. The Bureau is making good use of its American Community Survey data with the launch of the new Language Mapper widget. The interactive application displays a dot-density map for 15 separate languages and […]

What we can learn from national projections

Interested in our most recent work on population projections and estimates? See it all here.We released today population projections for the nation overall and for all 50 states (and the District of Columbia). These are the first projections to be produced using data from the 2010 Census, and they detail changes between 2020 and 2040 […]