Crime Statistics in 2012: Where does Virginia stand?
Have you noticed how many television channels currently have programs with story-lines woven around crime or law enforcement? With so many police dramas and crime series floating around the pool of broadcasting networks, I couldn’t help but wonder what the recent crime statistics looked like in the real world. These numbers are quite important because not only do they reflect the current state of security, but they help criminal justice agencies make informed decisions about how to manage and allocate their limited resources towards keeping our communities and its residents safer.
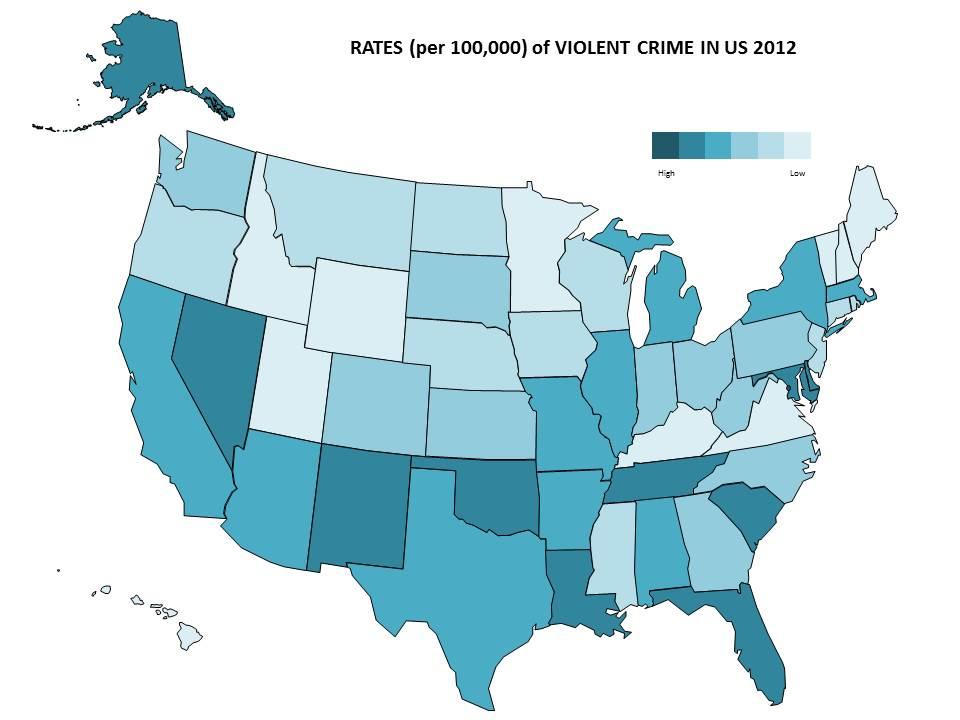
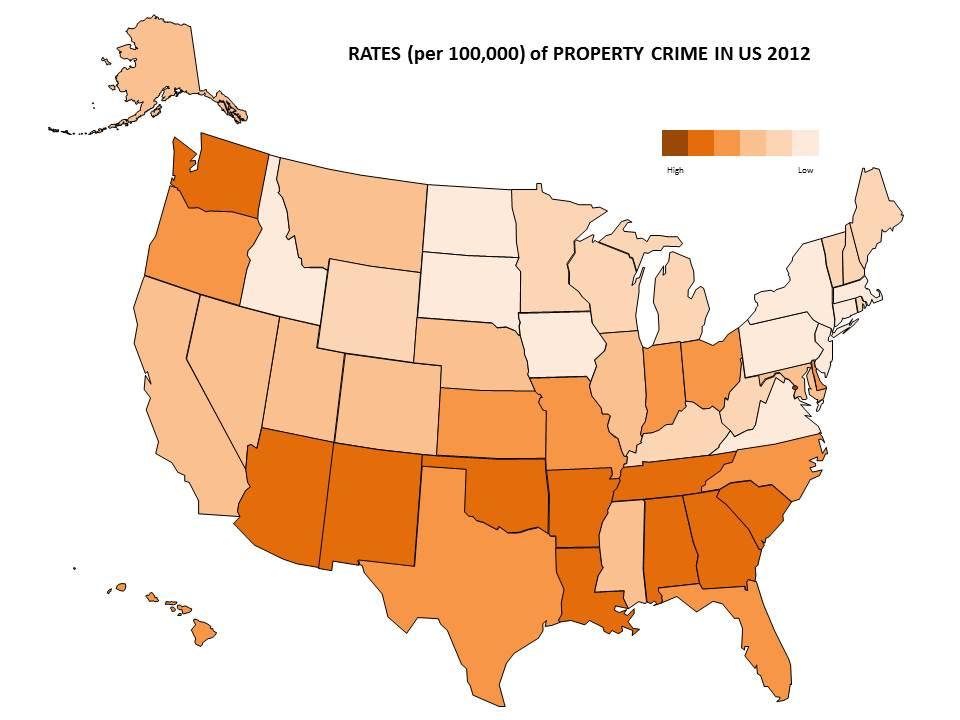
The FBI’s annual report Crime in the United States 2012 provides a snapshot of some facts and trends regarding criminal activity. Their estimates indicate that over the past year number of violent crimes has increased by 0.7% while the number of property crimes declined by 0.9%. Violent crimes (murder/non-negligent manslaughter, forcible rape, robbery and aggravated assault) which involve some form of force or threat of force against a victim had rates ranging from 123 in Maine to 1244 per 100,000 people in Washington D.C. Property crimes (burglary, larceny, motor vehicle theft and arson) on the other hand, are those where there is a loss of money or property and ranged from a rate of 1922 in the state of New York to 4861 per 100,000 for Washington D.C.


A glance at the maps above shows us that Virginia fares quite well compared to other states. But is this true of all regions in the Commonwealth? The recent Crime in Virginia 2012 report released by the Virginia Uniform Crime Reporting Program from the Department of State Police demonstrates an uneven distribution for estimated adult and juvenile arrests across the state. It is evident that there are some pockets that report higher number of arrests but these figures need to be understood in light of the area’s unique circumstances and characteristics. Several factors affect crime like population size, density and composition; socioeconomic conditions like employment and education; degree of urbanization etc. hence any insights we draw must be contingent upon the distinctive conditions affecting each locality. So if you are interested in knowing how your own county or city fared in terms of crime over 2012, take a look at the report here.
To gauge the frequency of all the offenses reported for the entire state, consider the following time-clock: approximately one crime against a person was reported every 5 minutes while a crime against property was committed every 2 minutes and a crime against society was recorded to occur once every 8 minutes. To wrap it up, here is a quick look at what kinds of criminal activity were most prevalent within Virginia over the course of 2012.

__________________________________
NOTES:
[1] The maps reflect the number of crimes per 100,000 people. Rates of Property Crime do not include arson data due to reporting discrepancies between agencies.
[2] Ranking the states on the national maps should be approached with caution as local law enforcement jurisdictions may report their data with varying levels of assessment or accuracy.
[3] At the state level, comparing different cities and counties on the basis of these reported crime statistics could also be misleading as there may be discrepancies in the data with respect to the categories or number of offenses estimated by different reporting agencies.


