Racial Segregation in Virginia’s Schools
Last week, May 17 to be exact, marked the anniversary of the Brown v. Board of Education decision, the 1954 Supreme Court case that declared racially segregated schools “inherently unequal.” Reading an op-ed this weekend that relayed some of the benefits of racially integrated schools piqued my curiosity about the status of school segregation in Virginia.
So I looked at the data, specifically, the fall membership data available from the Virginia Department of Education, including data on the number of black students, number of white students, number of economically disadvantaged students, and number of total students in each school in the 2011-2012 school year. From these, I produced a dissimilarity index – the segregation measure I discussed in a previous post – assessing how segregated black and white students were across the elementary schools in a school division (essentially, within a locality).
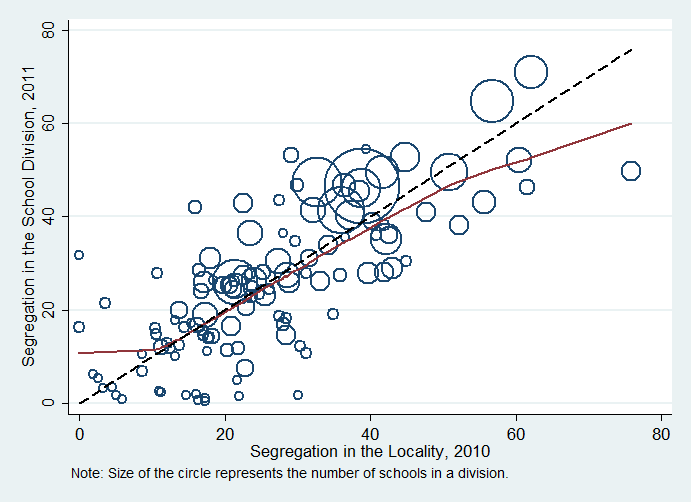
In my report on Blacks in Virginia, I noted that racially segregated neighborhoods produce more racially segregated schools. The graph illustrating the relationship is below:

School racial segregation clearly follows residential racial segregation. The figure plots segregation in divisions’ elementary schools in 2011 by segregation in the locality in 2010. The dashed black line represents a hypothetical one-to-one relationship, where a 1 point increase in neighborhood segregation produces a 1 point increase in school segregation; the solid red line estimates the actual relationship from the data.* The circles that represent each school division are sized proportional to the number of elementary schools in the division, so big circles represent divisions with more elementary schools.
Some observations about the figure:
- The two lines are pretty close, which shows that the relationship between neighborhood segregation and school segregation in a county is reasonably direct.
- The circles representing the school divisions are clustered pretty closely around the line, indicating that the relationship between neighborhood and school segregation is reasonably strong.
- Bigger school divisions tend to be above the dashed line, which means that they are a little more segregated than we would expect based on the neighborhood segregation alone.
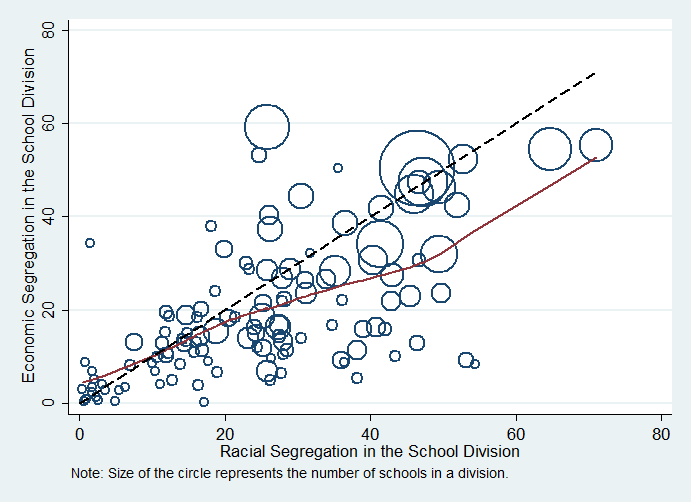
Many of the problems produced by racial segregation occur because racial segregation tends to concentrate poverty: in racially segregated areas, the poor are more likely to be spatially isolated within a small cluster of neighborhoods rather than spread out more widely across the locality. To see how this plays out in Virginia’s elementary schools, I also gauged economic segregation in the school divisions by looking at the distribution of economically disadvantaged students within the schools.
The two are unmistakably related.

Again, the black dashed line represents a one-to-one relationship and the solid red line represents the relationship found in the data.* Clearly, divisions with more racial segregation tend to have more economic segregation, though the relationship is not quite as strong as the relation between neighborhood and school segregation. In fact, most of the circles fall below the dashed line meaning that most divisions have less economic segregation than racial segregation.
*For the statistically curious, the relationship portrayed by the solid red line is estimated with a locally weighted scatterplot smoothing regression, aka LOWESS.


