Who’s winning the money game? Understanding campaign finance statistics
The big story right now in the money contest between Barack Obama and Mitt Romney is how the Republican challenger has been out-pacing the President in fundraising in recent months. In July, Obama and the DNC raised a total of $59 million while Romney and the RNC raised $78 million. But like all statistics (especially financial ones) the true story behind the numbers is a lot more complicated.
Unless you are financial expert or professional politico, the latest fundraising statistics can seem incomprehensible. Besides the jargon, the news outlets often use figures that don’t match one another or, at worse, report facts that seem contradictory. This is understandable. The rules and regulations governing campaign finance are complicated and it is not always easy to tell which candidate is doing better financially.
First, to begin to understand campaign finance statistics, you can think as if there are three avenues to raise money for a political campaign: (1) the candidate committees themselves (i.e. Obama for America or Romney for President), (2) the national parties, and (3) independent groups like PACs, Super PACs, 527s, and sympathetic non-profits (501(c)(4)s). Media outlets will more often than not focus exclusively on (1) or look at (1) and (2) together when they report fundraising statistics. Although Super PACs are getting a lot of attention in the news, seldom are fundraising totals for these groups considered in conjunction with their traditional counterparts.
Second, there is more than one way look at fundraising totals. Month to month totals can be illuminating to gauge which candidate has the current fundraising momentum in a race, but would be a poor measure of the financial strength of a campaign overall. Also, total money raised can be misleading, as it does not factor in spending. Many politicos focus on “cash on hand” totals to assess how much money a campaign currently has available for expenditures.
Lastly, it is important to remember that money will do a campaign no good unless it is spent. It is not necessarily a bad thing for a campaign to spend more than what it takes in for a particular month. As election day nears, it makes sense to spend and deplete campaign treasuries.
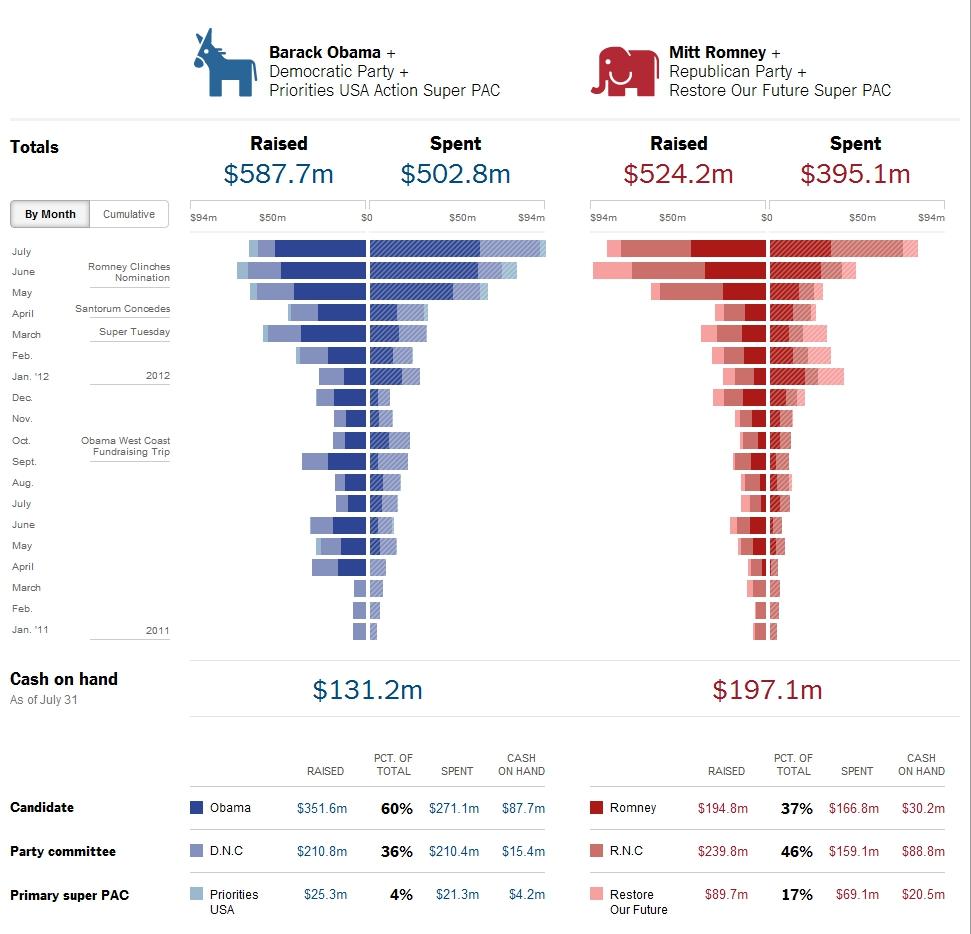
After pursuing the internet for a comprehensive yet straightforward summary of the presidential money race, I was initially disappointed. The Federal Election Commission (FEC) website makes all campaign disclosures available in their numerous databases, but unless you have expertise in navigating FEC data and the time to do it you will end up frustrated. Opensecrets.org is a great website that condenses a lot of campaign finance information into easily understood tables and graphics, but even here all of the information is not displayed in one place. However, as I was about to give up, I encountered a wonderful widget developed by the New York Times using their campaign finance API:

Not only does it make sense, but the widget is more comprehensive in scope. It includes the candidate committees, national parties, and the two major affiliated Super PACs as well. From this, it is easy to tell the story of the 2012 money race.
If one were to look only at fundraising and spending for the candidate’s campaign committees, as Opensecrets.org does, it would seem that Obama has been consistently beating Romney, even now. Yet when the parties and outside groups are factored in, Romney is now doing very well, out-fundraising Obama in recent months.
Other than Romney’s recent fundraising prowess, the second big new story is that Obama is now spending more than what he is taking in. This is true in recent months, but putting this fact into context with the fact that Obama has raised more money overall than Romney (especially during the Republican primary fight as seen in the NYT widget), this doesn’t seem that bad. Yet, the Democrats’ recent spending binge has cost them, and for the first time in the campaign, Romney and the Republicans’ cash on hand totals beat their counterparts ($197 verses $131 million). This is indeed a major concern for the Obama team. Unless they are able to pick up fundraising now, they will have much less available cash to spend in the closing months of the race.
Romney’s biggest financial advantage is that he has been able to attract big donors, either through direct contributions to the campaign or through independent groups. Forty-six percent of Romney’s donors for his campaign committee gave the maximum allowable contribution of $2,500, compared to 15 percent of Obama’s donors.
As much as I like the NYT widget, it fails to give an in-depth picture of the role of Super PACs and ignores one of the largest, Karl Rove’s American Crossroads. Some of these Super PACs are not exclusively focused on the presidential race, but still play a role. When it comes to looking at outside fundraising and spending by these groups I would recommend resources at Propublica.org. They created a great interactive graphic that highlights the major advantage Romney has in fundraising from big donors through outside Super PACs (thanks again to the NYT campaign finance API):

I also encourage readers to look at Propublica’s interactive tables on PAC fundraising and spending for more detailed numbers.
So who’s winning the money game? Depends how you look at it, but it would be hard to ignore Romney’s strong advantages in the closing months of this campaign. Whether all of this money in the presidential race makes any difference in how people will vote, however, is the subject of another blog post…


