Visualizing the age structure of Virginia’s local and regional populations
Population pyramids are graphs that show the distribution of a population by age group and sex. Bars representing age groups are stacked from youngest at the bottom of the graph to oldest on the top. A vertical axis in the center of the graph separates males from females in each age group. To enable standardized comparisons of populations of different sizes, the graphs often display the population of each age group by sex as a percentage of the total population rather than as a raw population number.
The interactive data visualization below shows population pyramids for the Commonwealth of Virginia and each of its localities and regions, including 15 workforce regions (Local Workforce Investment Areas) as well as eight regions defined by Cooper Center researchers. The visualization was created using the U.S. Census Bureau’s 2017 estimates of state and county resident populations by age, sex, race, and Hispanic origin.
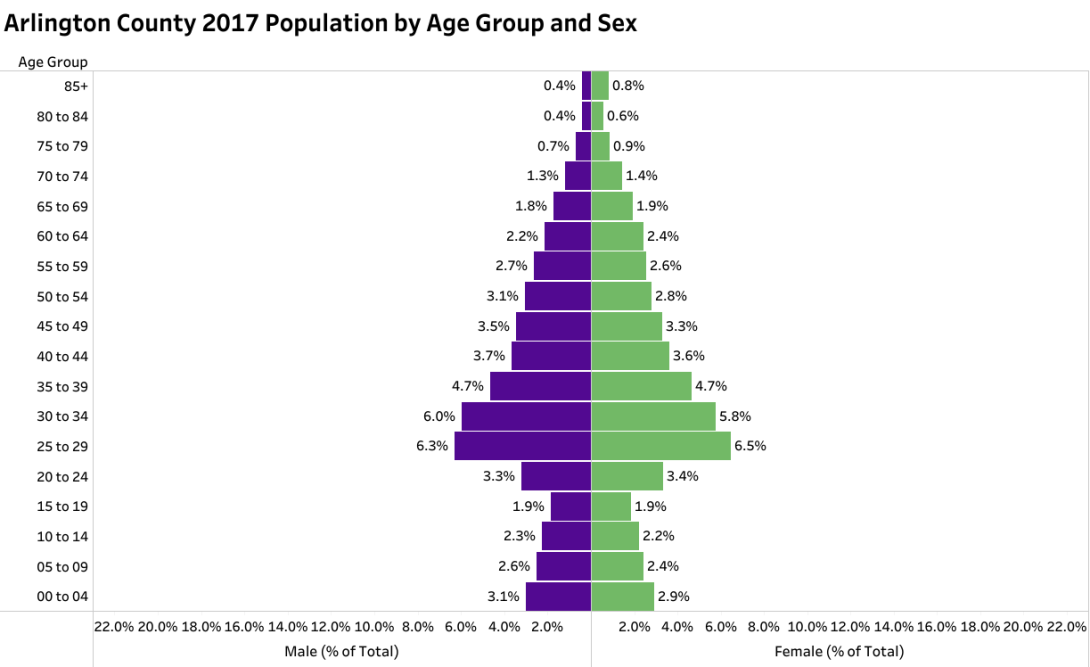
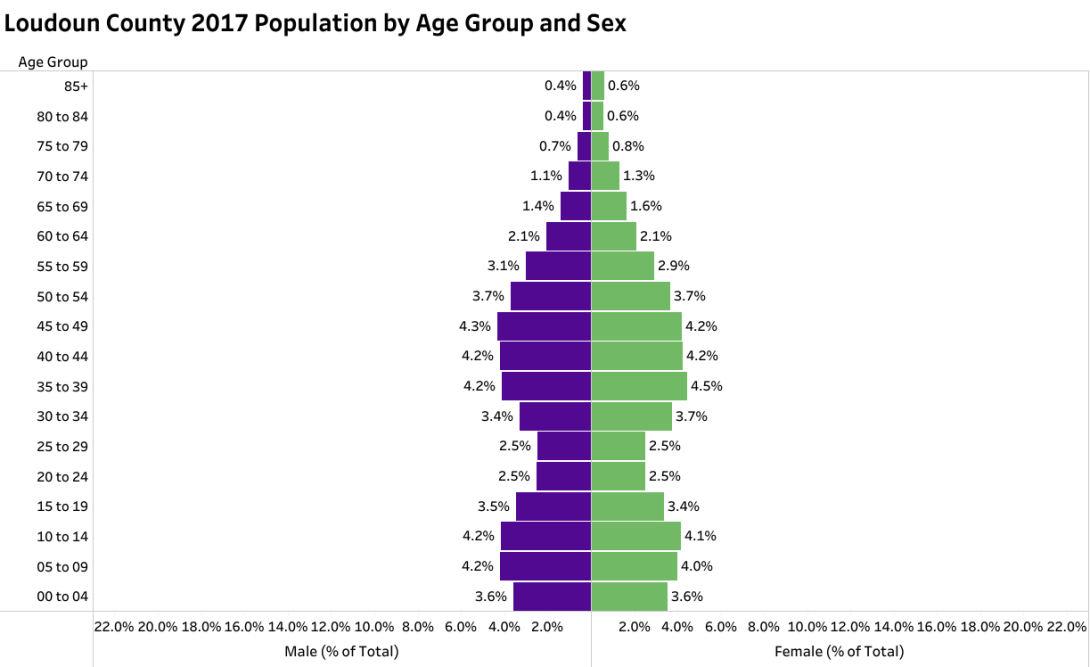
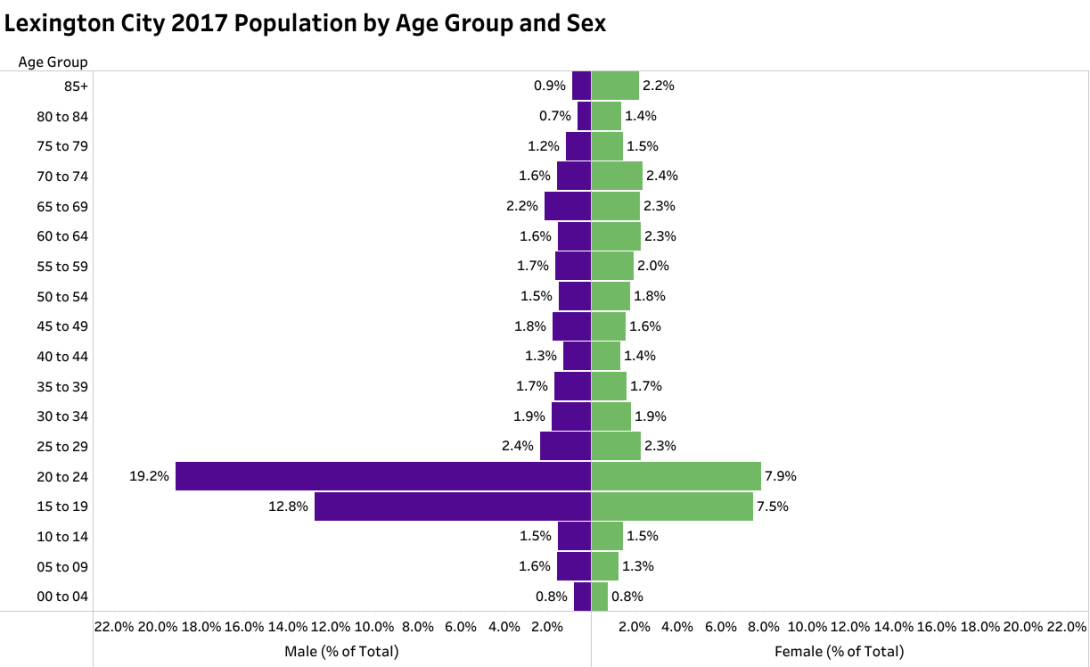
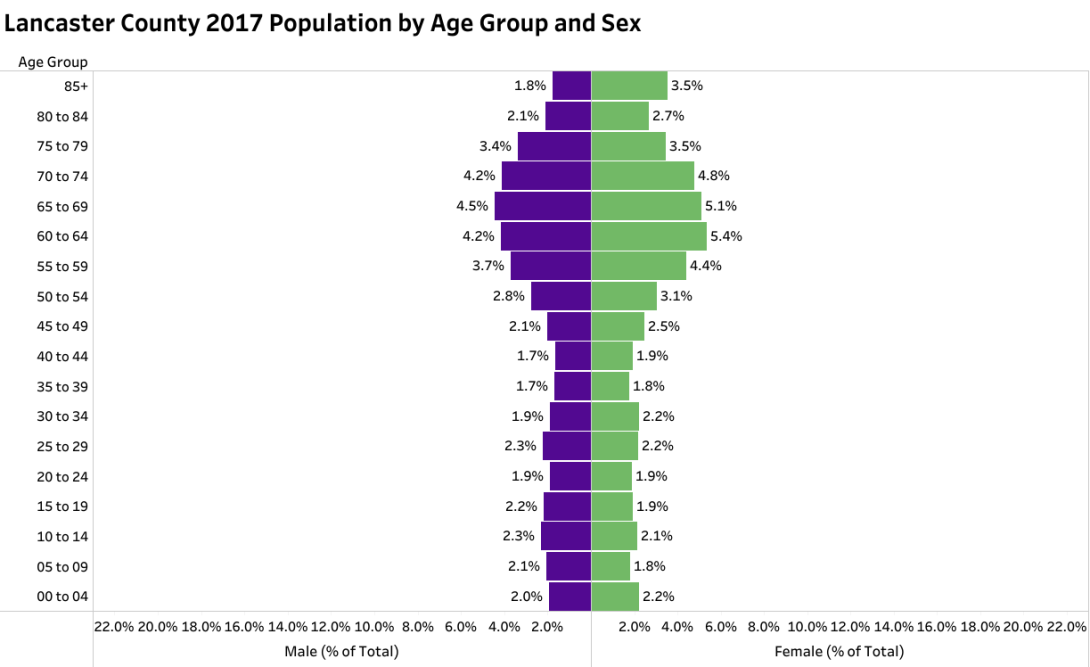
Population pyramids are useful for providing a quick, visual classification of a population’s age and sex structure at a particular point in time. Based on how the bars are distributed in the population pyramids of the four localities below, for example, the eye can quickly discern that Arlington County is dominated by a young, working-age population; Loudoun County consists of more families (middle-aged adults and their children); Lexington is a male-oriented college town (89% of students at Virginia Military Institute are male); and Lancaster County’s population is on the older end of the age spectrum, with nearly 60% of its residents age 50 or above. Population pyramids are also useful when compared across time to visualize how a population’s age and sex structure changes.


The Cooper Center’s Demographics Research Group provides the annual Census Bureau estimates in Excel format here, and you can access other states’ estimates and learn more about how the estimates are developed by visiting this Census Bureau web page.


