StatChat

How much does the social safety net help?

When it comes to the social safety net, myths and half-truths, rather than reality, often shape our conception of who depends on the net and the value of these programs. It is easy to lose sight of what these programs do for families, especially if one lives in a household that has never qualified for […]

Where Virginia legislators went to college

The Washington Post recently published a graphic showing where the 100 U.S. senators went to college. It might be nothing more than an interesting bit of biographical information about our elected officials, but it could also be meaningful. For educated and increasingly mobile Americans, college is often a formative experience and a college’s culture can […]

Even more evidence for the new donut

A while back, I wrote a post on the transformation of US cities over the last two decades, using Charlotte, Houston, Atlanta, and Denver as examples. That investigation, using graphs to show changes in the city from the core to the periphery, turned into a larger report that was just released today.In order to get a […]

Are the “urban millennials” a real thing?

There has been quite a bit of hype around the idea that millennials are gravitating towards city centers. Canadian professor Markus Moos calls it “youthification” and has recently put together some maps and data to prove it. But finding more hard numbers can be difficult. Is this hype only the result of a few hot spots like Brooklyn and Portlandia […]

Birth rates: Comparing Virginia’s counties with countries

One trend that was very noticeable in the recent population estimates for Virginia in 2014 was how much growth has slowed since 2010. While fewer people moving into the state was one cause for the slowdown, the other cause was Virginia’s declining birth rate. It is hard for any population to grow when it does […]

Changing Shape of America's Metro Areas

View graphs of the Changing Shape of America's Metro Areas. Each graph shows an individual demographic characteristic over time (1990, 2012 and 2015).

The 2010s are not shaping up to be anything like recent decades

Today the University of Virginia’s Weldon Cooper Center released the 2014 population estimates for Virginia’s counties and cities. The most notable trend is that Virginia’s population is growing much more slowly than in any recent decade, at an annual rate of less than 1 percent since 2010. The slowdown can be attributed to both fewer […]

America’s College Promise in Virginia

On Friday, January 9, President Obama announced America’s College Promise, his new vision for US community colleges, at Pellissippi State Community College in Knoxville, Tennessee, having released this teaser just the day before.In its press release on the plan, the White House explained its proposal to make community college “free for everybody who’s willing to work […]

Happy birthday, Mollie Orshansky!

Today, Ms. Mollie Orshanky, best know for her work on poverty, would have been 100 years old. Her research became the foundation for the Federal Poverty Guidelines. Though this measure has been criticized, it is important to remember Mollie Orshansky’s work was groundbreaking for its time.On her birthday, it is worth pausing to remember who […]

America’s shifting centers of gravity

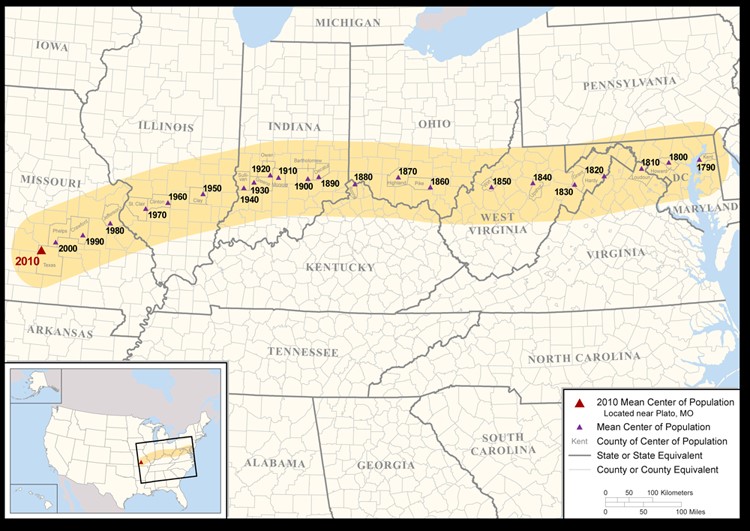
The map below was one of the more interesting maps produced after the census in 2010. It shows how the United States’ demographic center of gravity has shifted westward each census since the first in 1790. The center of population is essentially the point on which a flat, firm map of the United States would […]