Regional Cost of Living Adjustments for Poverty Rates in Virginia
Common sense tells us that the cost of goods and services are different in different parts of the country. For instance, the economic reality and expenditures of families living in Northern Virginia are not the same as those living in Lynchburg or those living in Wise County. The cost of housing and rent is particularly variable, but other basics such as food or transportation are surprisingly different across Virginia’s regions as well.
Despite common sense, official poverty rates do not account for this variability. The income threshold for poverty for a family living in New York City is the same for a similar family living in Fargo, North Dakota. More disturbingly, billions of dollars of government benefits and services are distributed to localities and families based on the official poverty measure. Other public and private organizations also use the official statistics to target their operations.
With so much at stake, a new poverty measure that addresses regional differences in the cost of living is needed. The Census Bureau has recently developed the Supplemental Poverty Measure (or SPM) to do this at the national level, but states and localities are at a disadvantage. Only 3-year SPM averages are available for states and none are available at the sub-state level.
Virginia, however, now has a new alternative poverty measure that accounts for regional differences in the cost of living and provides sub-state estimates of poverty rates. As elaborated in my previous post, the new “Virginia Poverty Measure” (VPM) provides some interesting insights about economic distress in the commonwealth, but perhaps the most striking results are the result of its regional adjustments.
The VPM uses Regional Price Parities published by the Bureau of Economic Analysis for its cost of living adjustments across geography. These price parities are similar to the Consumer Price Index (CPI), but instead of adjusting dollar values across time, the price parities adjust values across geographic regions. The price parities are indexed on the national average which is given a value of 100. Regions with index values above 100 have greater costs of living while those that have values less than 100 experience costs below the national average.
The following table shows price parities for all fifty states across different types of expenditures:

Virginia is 3% more expensive to live in compared to the national average. However, as shown in the next table, this is primarily because of the extraordinary costs of living in the Washington D.C. metro Area:

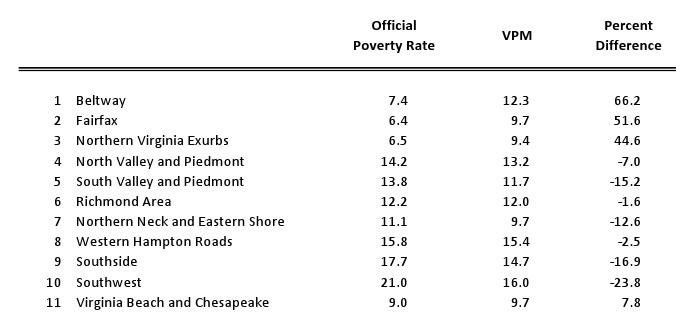
Northern Virginia has, on average, an 18.6% higher cost of living compared to the national average, one of the highest Regional Price Parity values in the nation. Using these to adjust poverty income thresholds for the VPM produces striking differences in poverty rates across Virginia, as shown in the table below from the full VPM report:

These alternative ways of measuring poverty provide surprising insights into the true population in economic distress. Using them in place of the official poverty measure for certain types of funding allocation schemes or benefit calculations could prove to be a more efficient and effective use of tax dollars. The Census Bureau stresses that its new SPM, that uses geographic adjustments, is for research purposes only. However, I hope this kind of research and state experimentation in alternative poverty measures, like the VPM and similar projects in Wisconsin and New York City, lead to replacing the official measure with something that conforms to common sense and better reflects the economic realities of different places.


