Predicting Sprawl

The Weldon Cooper Center, under contract with the Virginia Employment Commission (VEC), developed and released in 2012 the most recent round of official state population projections for Virginia. These projections, consistent with others commissioned or developed in the past by the VEC, focus primarily on trends in the number of people currently living in Virginia and expected to live in Virginia ten, twenty, and thirty years from now
It’s one thing to think about growth in terms of numbers of people, but another to think about it in spatial terms – as the growth of physical urbanized areas. For a while now, I’ve been working on a GIS model that will do that. I’ve posted it before on my own blog, but since then I’ve cleaned it up and made it follow our regional population projections more rigidly.
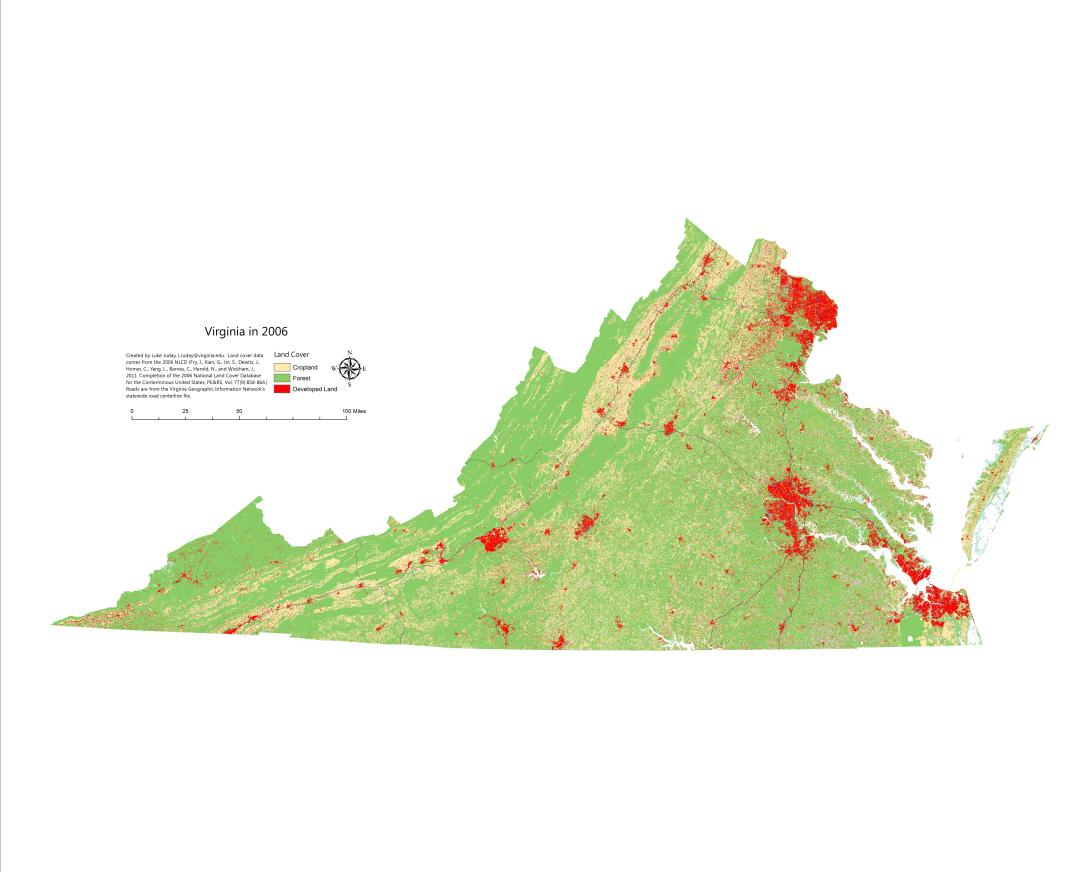
Today
Here’s a land cover raster (an image showing what primarily covers each 15Mx15M square of land) of Virginia in 2006. All developed land is in red. It’s a great image of the shape of our metro areas.
25 Years From Now
Here is a map of what that might look like in 2040 if:
A) The Weldon Cooper Center’s population projections are accurate at the Planning District level (the model is applied by planning district rather than by county).
B) No major game-changing roads are constructed (like the Charlottesville Western Bypass or the Prince William Bi-County Parkway)
C) Regions continue to develop at their current population density (more on this at the bottom).
D) Local zoning ordinances are largely ignored. This is an important one because it’s extremely difficult to include hundreds of zoning ordinances in the model, especially when they vary in complexity, change frequently, and are inconsistently applied.
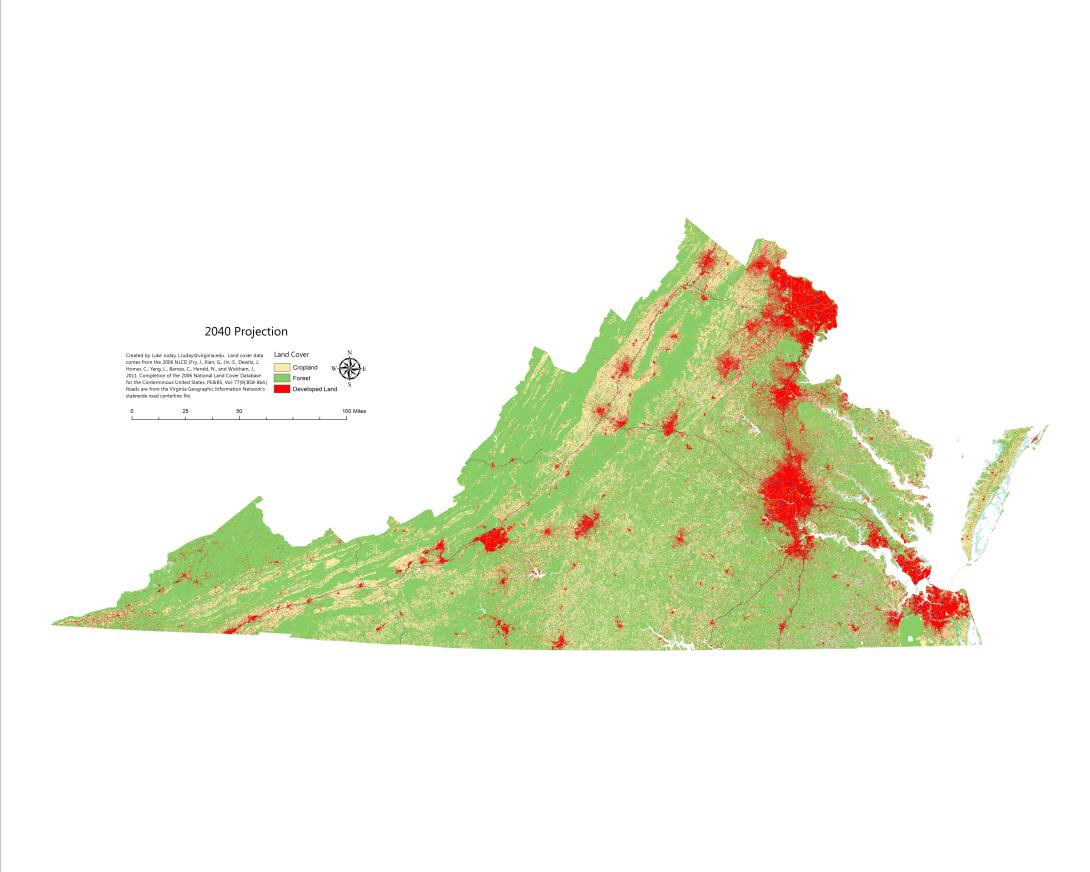
Now, this may not be the actual trend for a couple of reasons. It assumes that development continues to happen at the same low densities that have predominated for the past few decades, a trend some think is reversing. The housing bubble has had a significant impact on development, which may further alter the trend. And the number of vehicle miles traveled each year has fallen substantially for the first time since World War II:
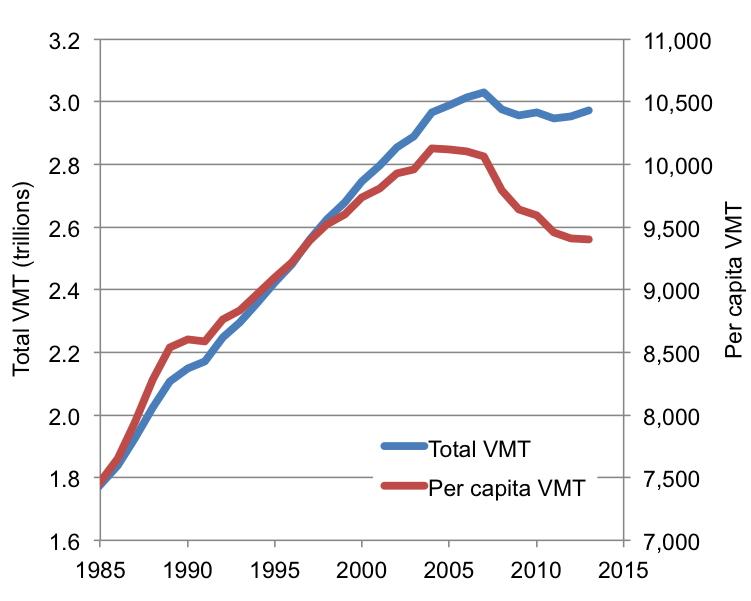
The explanations given for this are numerous and include higher gas prices, demographic changes such as the rising marriage age and falling birthrate, changes in culture, the rise of electronic devices, our decreasing willingness to fund major highway projects, the economic downturn, and the massive decline in urban crime rates. I won’t comment on those here, but it should be noted that they could all change this map in the near future.
50 Years From Now?
Finally, for illustrative purposes, here’s a map of what Virginia could look like in 50 years if population doubles again and continues to be distributed as projected for the next 25 years. This essentially extends the trends used for the previous map.
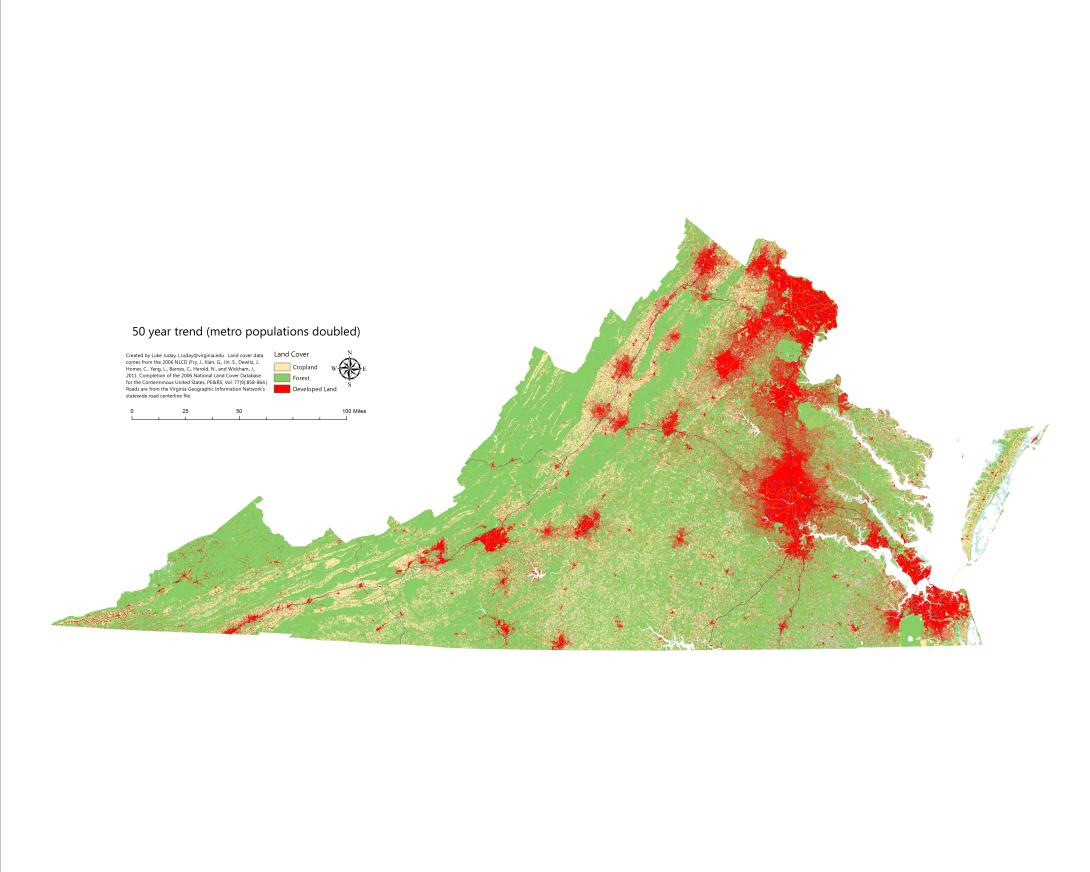
This map is just a visual representation and should be taken as such. Making actual predictions about metropolitan growth 50 years out is sort of absurd. As the Monty Python joke goes, “no one expects the Spanish Inquisition.” Holographic communication devices (or self-driving cars) could suddenly make commuting meaningless. An explosion of tech firms could cause Danville to become the new Silicon Valley. A new World War could start. Or the rise of major libertarian and pacifist politicians could make the economic base of northern Virginia and Hampton Roads collapse. The point being – we just don’t know.
A few observations from these maps:
1. Highways matter. Metropolitan growth is definitely concentrated along highways that offer quick access to central urban areas. This is an easy thing to see when generating service areas (driving distance radii) like the ones I used in this model. When thinking about building new highways (like the Bi-County Parkway in Prince William), we should recognize that land use and transportation are connected and should be considered together.
The image on the left shows a 45-minute driving radius from Washington, DC. On the right is a 22-minute driving distance from Richmond (with a 15-minute radius from Petersburg) to help illustrate why those metro areas have the shape that they do. The model I used factors in several other employment centers besides just the downtown.


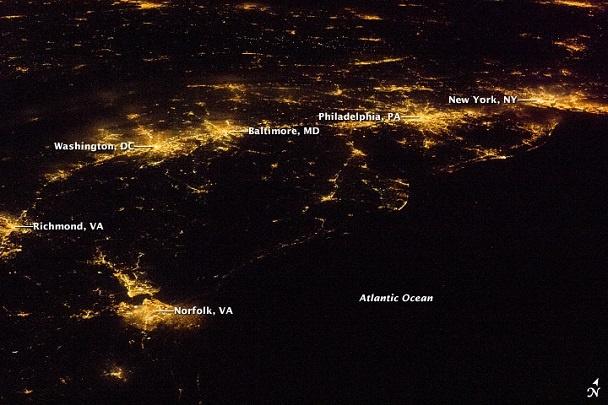
2. We’re hitching up our wagon to the northeast train. Fredericksburg and the stretch of 95 between Richmond and DC is becoming an important corridor. It could soon look like I-95 in New Jersey, with unbroken development sprawling between two major metropolitan areas. As metro areas bleed into each other, they start to influence each other, with commuters jumping easily between an hour commute to DC and an hour commute to Richmond. Richmond and even Hampton Roads will soon be part of the continuous Boston-to-Washington “megalopolis” that now has its southern terminus somewhere around Fredericksburg.
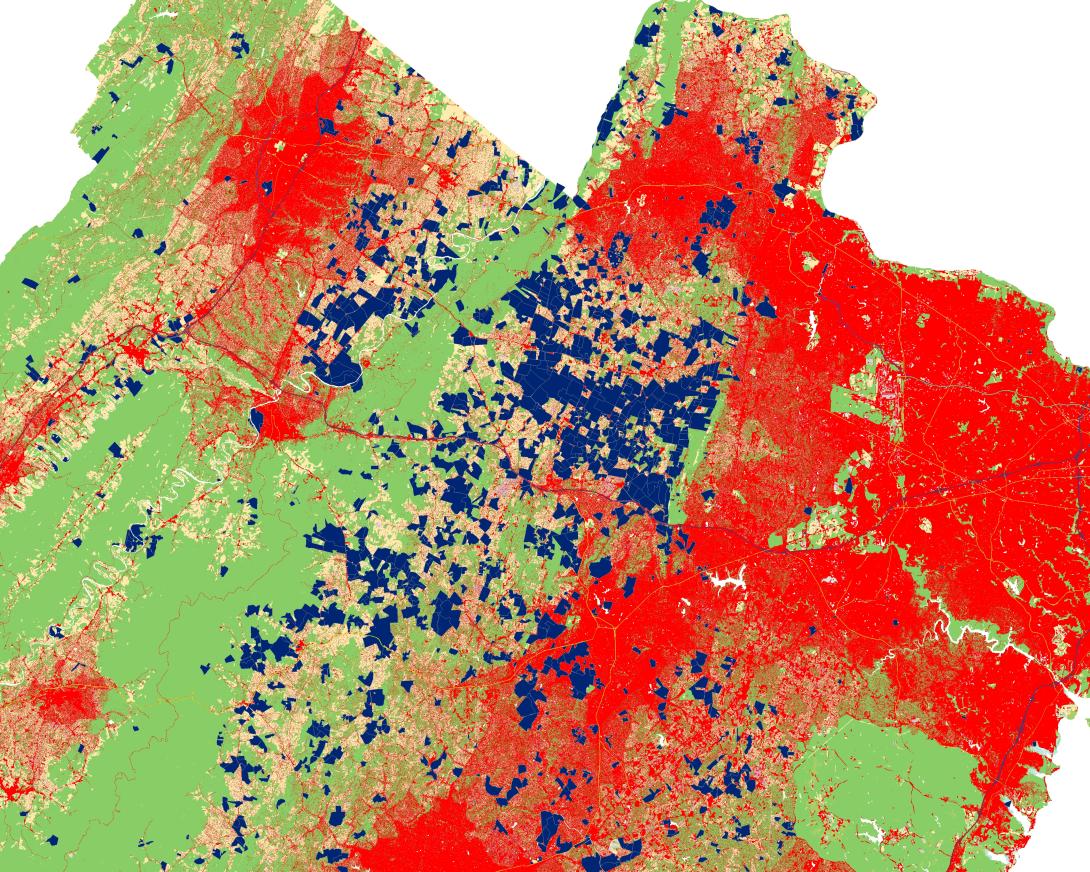
3. Conservation easements matter. There is a large contiguous block of easements stretching across northern Fauquier County that hasn’t “seen a lot of action” yet, but becomes very influential in both models (you can see it most clearly in the bottom one). Conservation easements are a powerful tool for redirecting growth, though there’s still plenty of debate about where and when growth should be redirected or if it should be redirected at all. Take a look at the 50-year map up top and then look at this one with the conservation easements overlaid:
Northern Virginia (with the DC area on the right and the Winchester area on the top left). Conservation easements are in blue:
Most readers of the blog may appreciate these maps for the stories they tell (or the fortunes they forecast) about Virginia. Some readers, however, may want to “take a look under the hood” to see how the maps are developed. If you are interested in the latter, check out this explanation or contact me for more information.


