Population growth and age distribution in Virginia
While the population of Virginia as a whole is projected to continue growing steadily over the next two decades (albeit at a slowing pace), the growth patterns of the 95 counties and 38 independent cities that make up Virginia vary tremendously, ranging from high growth to continuing decline. What can the age distribution of a locality tell us about its population trend? How are individual age groups trending? This post takes a unique visual look.
We’ll look at three topics that vary across localities:
- Overall population change
- Population age distribution
- Population change by age
For the graphics in this post, individual charts for each locality are laid out in a grid roughly the shape of Virginia so that we can look for potential geographic patterns while preserving even visual weight. The localities are color coded by regions (defined for their similar demographic and socioeconomic characteristics, and of course natural geographic proximity).
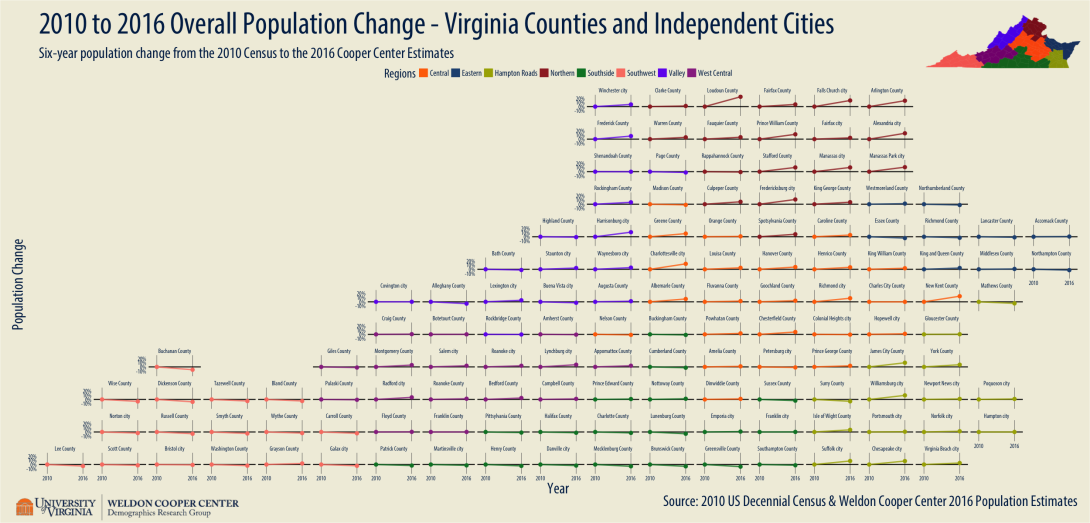
Overall Population Change

The general picture is the fastest growing localities are predominantly in Northern Virginia. Most other regions are flat by comparison. The cities that happen to be home to universities also tend to have experienced moderate growth. A number of rural localities experienced declining population totals, mostly in the Southwest and Southside regions.
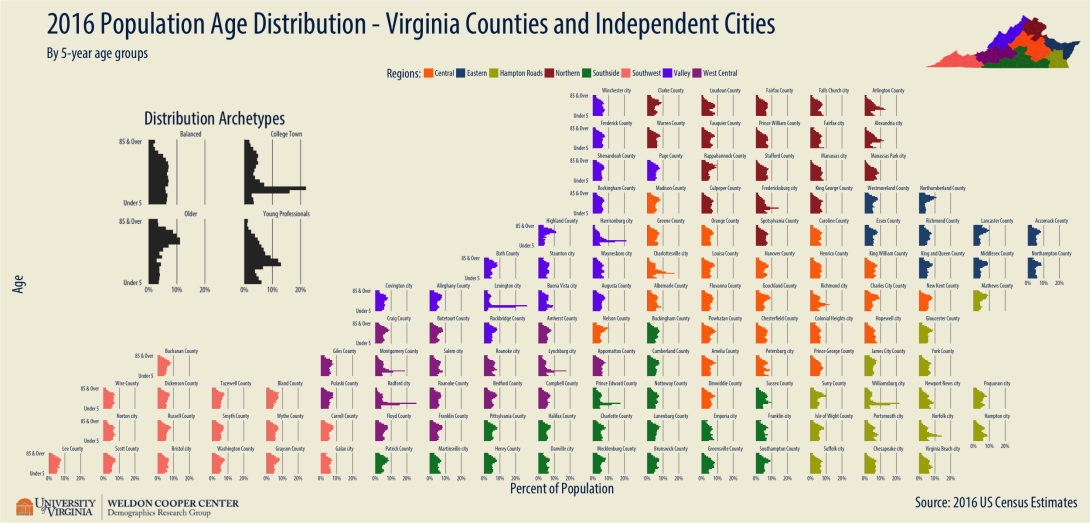
Population Age Distribution
As the fundamental components of population change are births, deaths, and migration, the age composition of individual localities can indicate growth or decline. People in their 20s to 40s, for example, are more likely to migrate and have kids, while the older-age population is less likely to move and more likely to die. As such, we can associate certain age structures with potential growth patterns.

I’ve highlighted four distinct archetypal population age structures. Localities might be a blend of multiple archetypes, but there are helpful key ideas about each when thinking about potential growth.
- Balanced: This structure has a smooth age distribution. No age group is particularly over or under-represented. The balanced distribution is the most neutral distribution for population change, with a tendency for slight growth. Fairfax County, Henrico County, and Suffolk city are example localities that might fit this description.
- College Town: These localities are characterized by a large spike in the population, primarily in the college age groups. College towns attract a continuous stream of revolving young students and can serve as economic anchors that weather economic volatility better than other small towns. They tend to have moderate growth. Williamsburg city, Lexington city, and Radford city are the purest examples of college towns.
- Young Professionals: These are mostly urban localities. The age structure is characterized by heavy representation in the early-career ages of 20s and 30s. Young children are also more represented than older children, as later career parents are more likely to migrate to more suburban localities. Arlington County and Alexandria city are good examples. These localities continue to have significant growth in this decade.
- Older Population: These localities have an over represented share of older population, and increasingly experiencing more deaths than births. They also tend to lose younger people who seek better education or employment opportunities elsewhere, although some have also attracted retiree population. These localities tend to have shrinking populations. Example localities include Highland County and Northumberland County.
These archetypes are important, but still only rough guides. Some localities have blended features. Charlottesville City, for example, sits between College Town and Young Professionals.
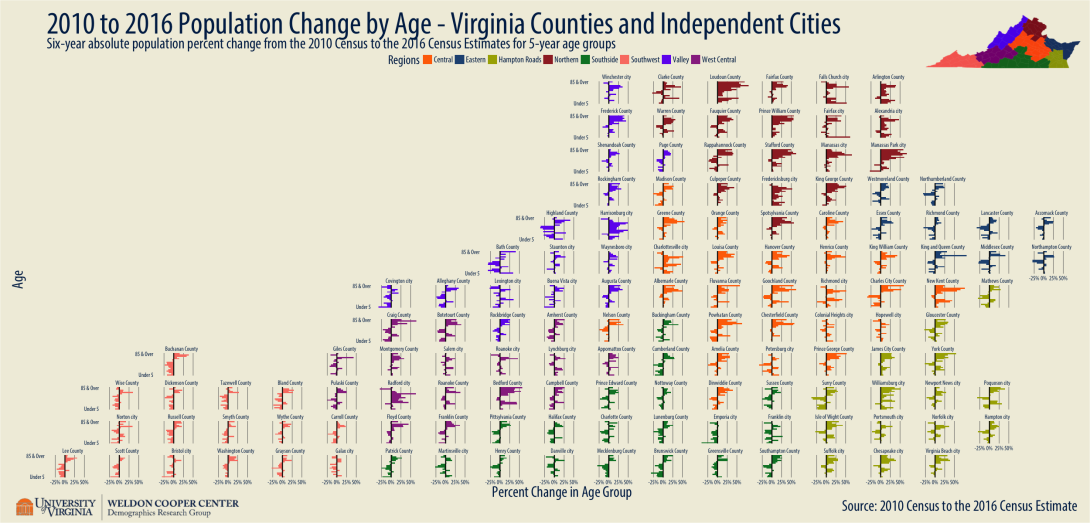
Population Change by Age
To further illuminate the variance in growth patterns, I looked at population growth by age groups.

This shows the absolute growth percent. While the older population Northern Virginia’s Loudoun County doesn’t make up a large percent of its overall population (as shown in the second chart), the absolute growth in the last six years among different older age groups were quite significant—between 25 and 50 percent.
These age-specific change trends are perhaps most informative to planners. For example, localities with multiple bars on the left of the black line at younger ages and multiple bars on the right in retirement ages deserve careful consideration. It is a sign of a top-heavy, rapid-aging population that may require strategic planning to adjust available services like schools, housing, transportation, healthcare, and others.
None of these charts captures the whole picture by itself. They support each other. Depending on the goals of communities, businesses, and policymakers, these information provide important context for planning and decision-making.
This post has been edited to correct graphic labels.


