Language diversity in Virginia speaks volumes
Religion, race, ethnicity, citizenship, and ancestry are just some of the characteristics used by people to identify themselves, to be part of a bigger community, and to enhance social cohesion. Language plays an important role in this mix. It provides a medium to communicate, carries its own cultural identity, and, like most other social identifiers, it has the ability to unite as well as divide. Demographic data is a constant reminder that diversity in Virginia is rising, so I thought it would be interesting to use language as an indicator of this diverse social landscape and see what languages are most commonly spoken across the Commonwealth.
A while ago, I came across an article exploring language use at the national level, which demonstrated how languages spoken in American homes vary across the 50 states. This map lists Korean as the most commonly spoken language-other than English and Spanish-in Virginia as a whole. However in this analysis, the differences across localities gets eclipsed and we miss out on the variety of languages spoken within the state itself. So let’s take a look at the most common languages spoken in each of Virginia’s cities and counties.
Before looking at the maps, let me explain a bit about the data. The 5-year estimates from the American Community Survey is a great source to explore languages spoken at home, for the population over the age of 5.

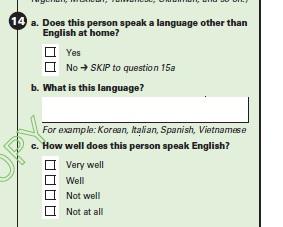
The questions in the survey (look left) are open-ended, so respondents can provide their own spoken language in as much detail as they choose. The Census Bureau then clumps certain languages into groups (such as aggregating African Languages or Scandinavian Languages) prior to reporting the data for public use, so it may not be completely fair to compare a single language to a combined category of multiple languages. Also, this is survey data, so while in a perfect universe the sample of respondents should perfectly represent the larger population, we should (as responsible data users) acknowledge the margins of error involved in the construction of these estimates. Finally, this is all based on self-reporting from the people surveyed.
[NOTE: The maps below are all interactive, scrolling the mouse or using the +/- will enable zooming, clicking on each locality will provide more details, and the >> arrow will make the legend visible and list the abbreviations used.]
This first map simply looks at the most commonly spoken language within Virginia between 2009-2013. The results show that English is the most common language spoken at home in all 134 localities. But notice the variation in percentages (reflecting the share of the population who speak only English at home) across the map, with a range from 99.46% in Highland to 55.58% in Manassas Park.
If we drop English from the mix, then the map reveals that Spanish is the next most commonly spoken language in Virginia, with only 5 localities serving as exceptions. Here too, the percentages indicate what proportion of the population actually speak the language listed on the map.
When both English and Spanish are eliminated from the mix, the third map shows that there are a variety of languages spoken across localities. However, we must keep in mind that the actual number of people speaking each of these languages may not be very high.
The map above is for 2009-2013. To see how a locality may have changed over time, the next map plots the most commonly spoken language (except English and Spanish) for 2005-2009.
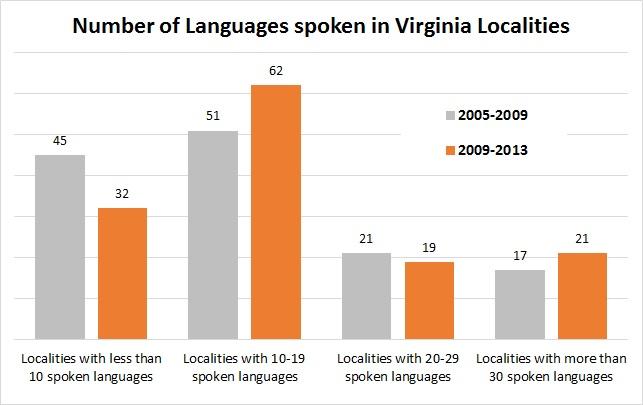
The graph below shows this inter-temporal comparison better, with the number of localities that speak several languages expanding over time. By 2013, 21 cities and counties reported speaking at least 30 or more languages.

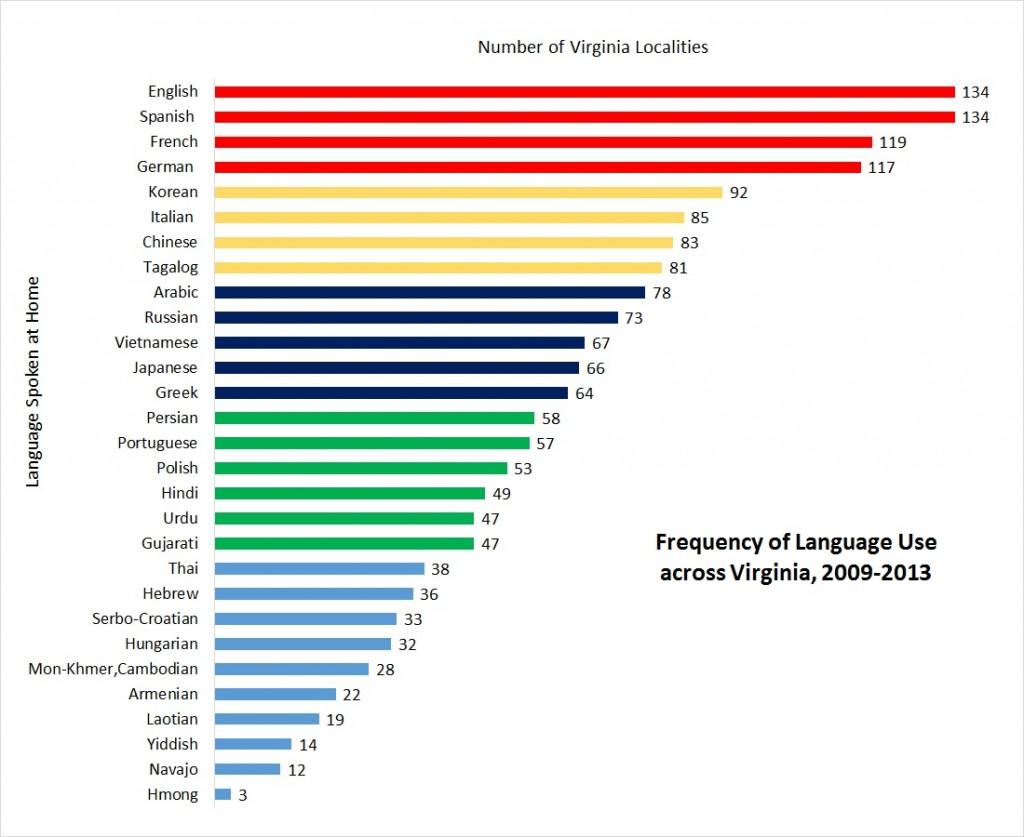
Switching our attention to the languages themselves, we can rank some of them by popularity in 2009-2013 – that is how frequently they show up across the localities. Spanish and English are spoken in every city or county in Virginia, but French and German are also very popular. Korean, the next most common language, is spoken across 92 localities.


The variety of languages spoken in so many areas in the state adds to the cultural diversity in Virginia. The predominance of English and Spanish aside, it was interesting to observe that though a language may show up on the map as most commonly spoken in Virginia households, the actual share of people who actively use the language (percentage share of language usage among the resident population) varies widely across both languages as well as localities.
Data Source: All data is from the American Community Survey, 5 year estimates from 2005-2009 and 2009-2013


