Growing number of Virginians with disabilities
We can expect the number of Virginians with disabilities to increase in coming years, leading to increased demands for services such as Social Security Disability or home-health services. There are for two reasons for this:
- Increases in life expectancy. Disability is much more common at older ages; as people live longer, they will be more likely to live long enough to develop a disability.
- Aging Baby Boomers. The large cohort of Baby Boomers began to turn 65 in 2010; disability rates increase substantially after age 65. Statewide and nationally, the population 65 and older will grow as the Baby Boomers age.
Since 2008, the American Community Survey, administered by the U.S. Census Bureau, has asked a set of questions to capture six dimensions of disability. The types of disability reported range from sensory disabilities (vision and hearing), difficulty performing self-care tasks such as dressing or bathing, or difficulties performing activities associated with independent living such as shopping or going to the doctor.
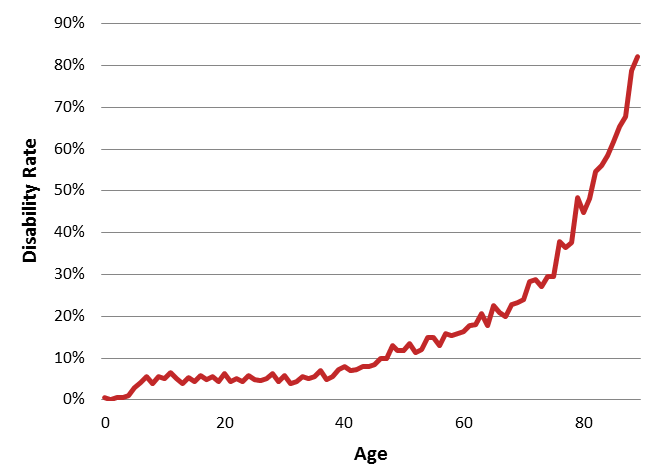
The proportion of disabled individuals in Virginia increases dramatically with age, as shown by the graph below. Fewer than 5 percent of Virginians under the age of 30 report any disabling condition while more than one in three Virginians ages 65 and older report at least one disability.

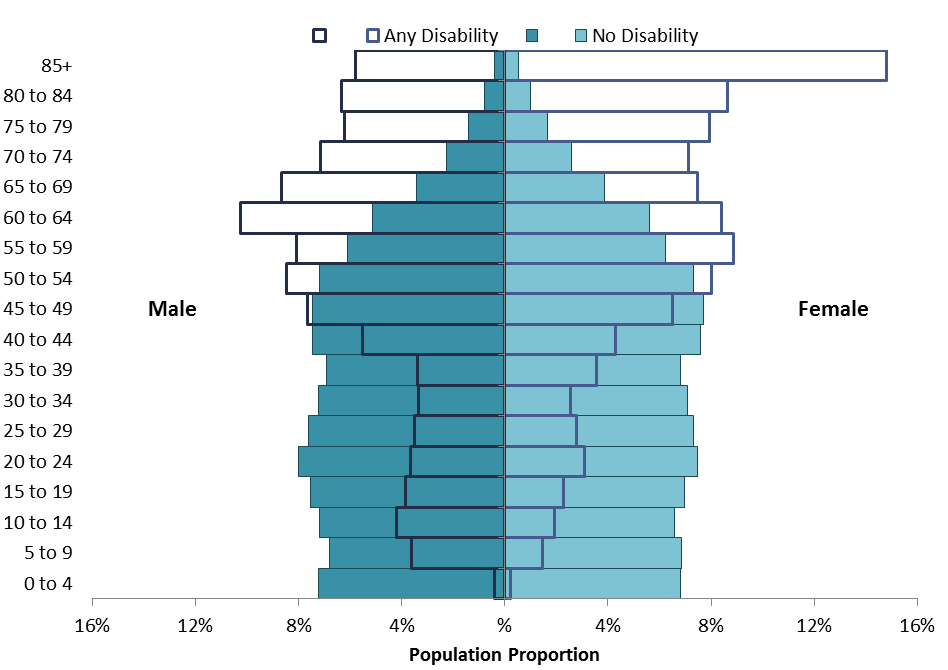
These patterns are further highlighted in the age pyramid presented in the chart below. The solid blue bars represent the population proportion of Virginians with no disability by five-year age groups and by sex. Instead of a pyramid, Virginia’s non-disabled population distribution is more rectangular, reflecting both the influx of working-age migrants to Virginia and the large cohort of Baby Boomers.

In contrast, the distribution of Virginians reporting any disability (the hollow bars) is an inverted pyramid, showing that the majority of Virginians with any disability are 45 or older. The higher proportion of women 85 and older in the population reporting any disability reflects sex differences in longevity beyond the age of 85.
While disability rates increase with age, more than half of Virginians living with disabilities are of working age, between the ages of 16 and 64. A recent Cooper Center report provides detail on the demographic, social, and economic characteristics of working-age Virginians with disabilities.


