ELECTIONS 2020: Projecting eligible voters by state

Political punditry and polls often form the basis for predicting election results, but rarely are they consistent or comprehensive. Given the importance of state-level voting, and the central role played by the Electoral College in the democratic process, projecting the number of eligible voters in each state may add value to understanding the November 2020 election cycle. For the current analysis, eligible voters are defined as U.S. citizens ages 18 and over, including those born in the U.S. as well as those born in other countries who have immigrated and become naturalized citizens.1
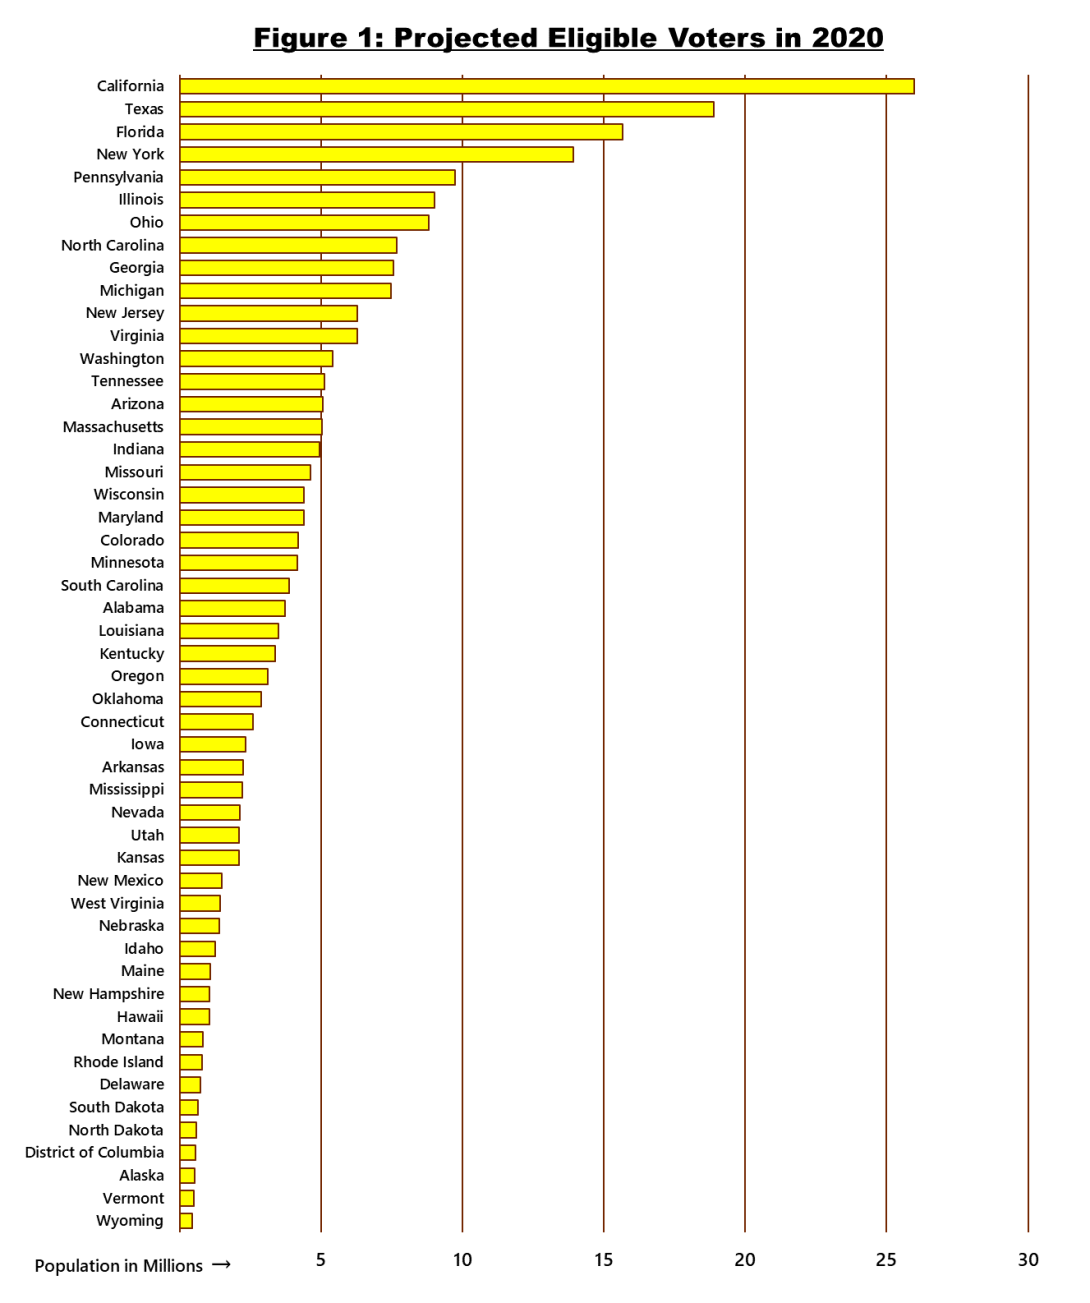
The sheer population size of the individual states is a good starting indicator of how large a pool of potential voters may reside in them. If the elections were held today, California would have over 25.8 million voters, while Wyoming would have fewer than 500,000 people eligible to vote. Texas, Florida, and New York would each be home to over 10 million eligible voters, closely followed by Pennsylvania and Illinois.
Beyond age and citizenship, additional requirements set by the states may determine whether someone is eligible to cast a ballot. Mental incompetence or incarceration, for instance, may restrict voting privileges, and widely-varying state practices for voter registration may have differential impacts on voter participation. For purposes of this article, I use voting-eligible U.S. citizens to project a generalized picture of the future electorate–a number which should not be confused with either the number of registered voters, or with actual voter turnout on Election Day. Not every eligible voter is registered to vote, and not every registered voter goes to a polling place on Election Day.
By applying2 the 2018 American Community Survey age and citizenship data to our 2020 National Population Projections, we project how many eligible voters are expected in 2020.
[Data available for download here]

More than 70% of the overall U.S. population will be eligible to vote in the general election in 2020. These 235 million eligible voters are not uniformly distributed across the country, however. Figure 1 shows the distribution of potential voters in 2020 for the 50 states and Washington, D.C. The states of California, Texas, Florida, New York, Pennsylvania, Illinois and Ohio account for over a 100 million (or 43%) of all eligible voters.

The map in Figure 2 shows the percentage of the overall population for each state in 2020 eligible to vote. Over 75% of the population in the states marked green, for example, are potential voters for next year’s election.

While some states lead the nation in the number of potential voters, those states may not have the highest percentage of their state’s residents eligible to vote; and the converse may also be true. This is best demonstrated by looking at California in 2020, which may have a population size of over 40 million, but only about 25 million will be eligible to vote next year, accounting for less than 65% of the total population. On the other hand, Vermont will have more than 79% of its population eligible to vote, but accounts for only 493,000 potential voters. Usually, states which are younger (with large under-18 populations) or which are home to large numbers of non-citizens tend to have lower shares of eligible voters in their population.
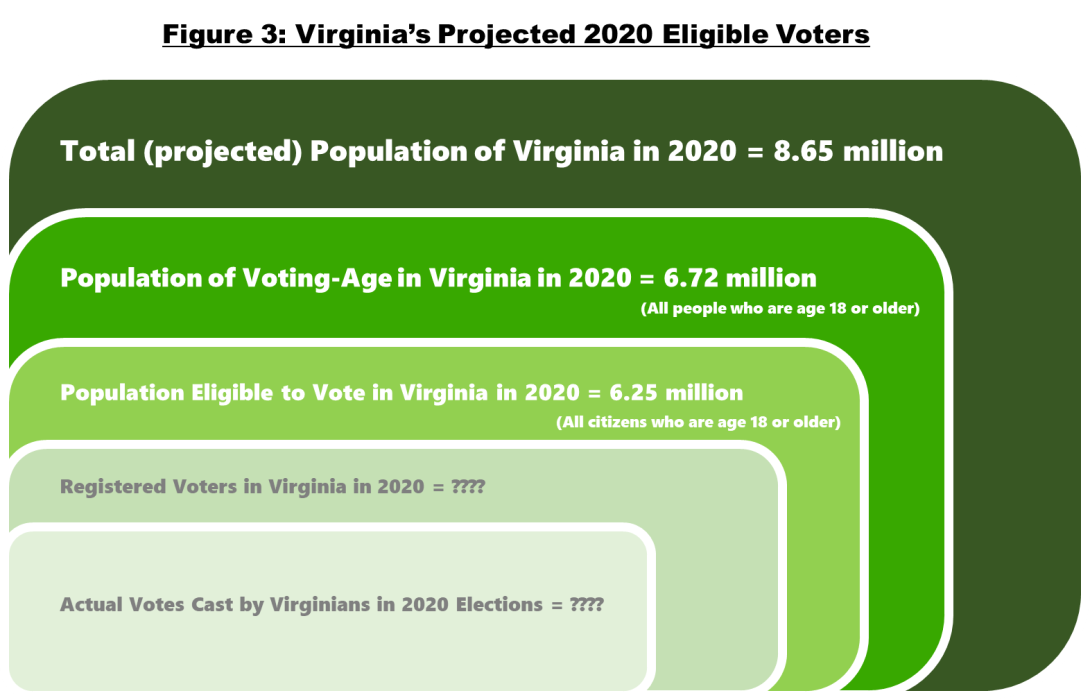
It is important to remember that these numbers reflect the 2020 voting-eligible population, which typically exceeds both the population of registered voters and the actual turnout. For instance, in the case of Virginia, the successively shrinking boxes3 in Figure 3 illustrate several tiers in between the total population in the Commonwealth and the actual number of votes cast and counted. Virginia is expected to have a population of 8.6 million in 2020, but only 6.3 million will be eligible to vote. A subset of this population will be registered to vote, and an even smaller subset of the registered voters will actually show up to the ballot box and vote on Election Day.

Understanding who can vote is different from knowing who will vote. Stepping away from the campaigns and the candidates, these state-by-state projections highlight where we find the pool of eligible voters who may participate in the 2020 election.
FOOTNOTES:
- Among U.S. residents aged 18 and over, 83% are native-born citizens and 9% are naturalized citizens; and they are eligible to vote. The remaining 8% are not eligible to vote, such as foreign-born individuals with permanent residency (green cards but not U.S. citizenship) or temporary visas (for work or study), as well those without proper legal documents.
- Methodology overview: 2020 eligible voters = (2018 eligible voters)/(2018 population 18plus)*2020 population 18plus
- Area of boxes are representative, and not to scale.


